Technical analysis with Indicators & candlestick patterns

Why take this course?
🎓 Master Technical Analysis with Satyendra Singh 🚀
Course Title: ✨ "Master Trading Strategies Using RSI, ADX, Bollinger Bands & More!" ✨
Headline: 📈 "Unlock the Secrets of Candlesticks, Indicators, and Patterns for Successful Trading!" 📈
Course Overview: Dive into the world of technical analysis with our comprehensive course led by Satyendra Singh, a NCFM and NSIM certified expert. This course is meticulously designed for both technical analysts and those who prefer to trade without relying on indicators. Get ready to master trading strategies that leverage powerful tools like RSI, ADX, Bollinger Bands, Support & Resistance, MFI, Pivot Points, and more. Whether you're a portfolio manager, a technical wizard, or an aspiring trader, this course will equip you with the skills to navigate the markets confidently.
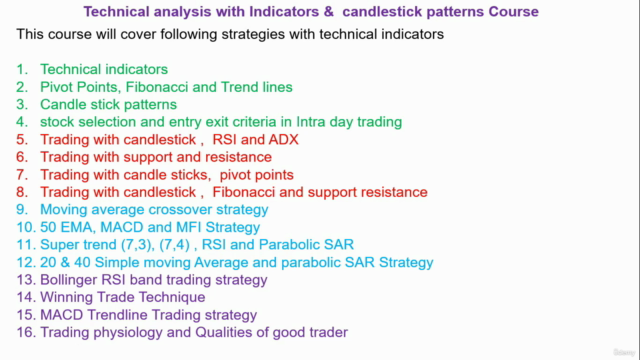
Strategies Covered:
-
🕵️♂️ Candlestick Analysis & Indicator Integration
- Learn to trade effectively using candlestick patterns combined with RSI and ADX.
-
🧮 Support & Resistance Strategies
- Understand the pivotal role of support and resistance levels in your trading plan.
-
🌍 Candle Stick Patterns & Pivot Points
- Discover how to trade using pivot points alongside candle stick analysis.
-
📈 Fibonacci Retracement & Support Resistance Harmony
- Explore the interplay between Fibonacci levels and support/resistance for precision trades.
-
🚫 Moving Average Crossover Strategy
- Learn to anticipate market turns with the help of moving averages.
-
🎯 50 EMA, MACD & MFI Approach
- Combine the Exponential Moving Average (EMA) with MACD and MFI for a powerful trading edge.
-
📉 Super Trend & RSI in Action
- Utilize the adaptive trading range of the Super Trend along with RSI and Parabolic SAR.
-
✅ Simple Moving Average (SMA) & Parabolic SAR Combination
- Simplify your strategy with a potent mix of 20 & 40 SMAs and Parabolic SAR.
-
🛣️ Bollinger RSI Band Trading Tactics
- Navigate the market with precision using Bollinger Bands and RSI.
-
🏆 Winning Trade Technique
- Discover a systematic approach to finding high-probability trades.
-
📊 MACD Trendline Trading Strategy
- Master the MACD trendline for a clearer view of market momentum.
Additional Topics: 12. 🔍 Technical Indicators Explained - Gain a solid understanding of CCI, ADX, RSI, Moving Averages, and more.
-
📈 Pivot Points, Fibonacci & Trend Lines
- Learn how to use these tools to identify potential market turns.
-
🔥 Candlestick Patterns
- Recognize and interpret various candlestick patterns for informed trading decisions.
-
🎯 Stock Selection & Entry Exit Criteria
- Learn how to select stocks and set entry and exit criteria for intra-day trading success.
-
🧘♂️ Trading Physiology & Qualities of a Good Trader
- Understand the psychological aspects that contribute to successful trading.
-
📹 Live Trading Sessions
- Observe Satyendra Singh trading in real-time on 15-minute timeframes, capturing and sharing his strategies.
Special Notes:
-
🛠️ Major Technical Indicators Focused On:
- CCI, ADX, RSI, Moving Averages (including Super Trend), and more will be covered in depth.
-
🚫 Price Action Trading Without Indicators
- For those preferring a non-indicator approach, learn strategies like 15-minute candlestick breakouts and previous day open/low/high breakouts.
-
🤝 Paper Trading Opportunity
- Apply the strategies you learn with paper trading to refine your approach before risking real capital.
-
⏰ Ideal Time Frames for Trade Discussed
- Understand which time frames are most suitable for different trading strategies.
-
🤫 Online Support Available
- In special cases, receive online support to assist with your trading journey.
Enroll now and transform your trading strategy with the expert guidance of Satyendra Singh! 🚀📚
Course Gallery


Loading charts...