The STATA OMNIBUS: Regression and Modelling with STATA

Why take this course?
📚 Non-Linear Regression Analysis:
Non-linear regression analysis is a set of statistical methods used to model the relationship between a dependent variable and one or more independent variables when the relationship is not linear. Here's a brief overview of the topics you've listed:
-
Types of Non-Linear Regression Analysis:
- Curve fitting, where the functional form of the relationship is known and parameters need to be estimated (e.g., polynomial regression).
- Optimization methods (e.g., least squares for non-linear models, or maximum likelihood estimation for models like logistic regression).
-
How Non-Linear Regression Works:
- The process involves specifying a hypothesized functional form that you believe represents the relationship between the variables.
- Estimating the parameters of this model using either iterative numerical methods (like Newton-Raphson) or optimization techniques (like gradient descent).
- These methods attempt to minimize the difference between the observed values and those predicted by the model, often by squaring the differences (least squares).
-
Usefulness of Non-Linear Regression:
- It allows for a more accurate representation of real-world relationships that are inherently non-linear.
- It can provide better fit to data with curvilinear relationships, interactions between variables, or complex patterns.
-
Maximum Likelihood (ML):
- A statistical method used to estimate the parameters of a model in situations where the observations are dependent or the model has a particular form that is best estimated by this method.
- ML provides estimates for parameters in models like logistic regression, which assume independence between observations.
-
Linear Probability Model:
- A model similar to linear regression but used specifically when the dependent variable is binary.
- It assumes a linear relationship between a binary outcome and one or more independent variables.
-
Logit and Probit Regression:
- Logistic regression (logit) models the probability that a given observation falls into one of the categories (often binary).
- Probit regression is similar to logistic regression but uses the cumulative distribution function of the normal distribution to model probabilities.
-
Latent Variables:
- Used in statistical models like factor analysis where the observed variables are assumed to be manifestations of a smaller number of unobserved (latent) variables.
-
Marginal Effects:
- In econometrics and statistics, marginal effects measure the effect of a change in an explanatory variable on the expected value of the distribution of the dependent variable.
-
Dummy Variables in Logit and Probit Regression:
- Dummy variables are used to represent categorical variables with two or more categories in regression models, including logistic and probit regression.
-
Goodness-of-Fit Statistics:
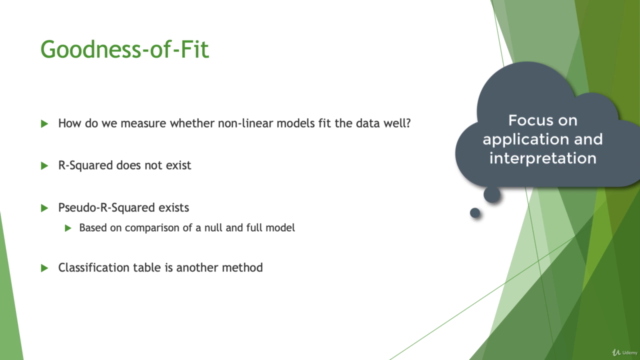
- Statistical measures such as R-squared, pseudo R-squared (McFadden's R-squared for logistic regression), Akaike Information Criterion (AIC), and Bayesian Information Criterion (BIC) are used to assess the fit of a model.
-
Epidemiological Tables:
- Used in public health research to summarize the findings from cohort, case-control, and matched case-control studies.
-
Power Analysis:
- Helps in determining the sample size needed for a study to achieve a desired level of power (the probability of detecting an effect if it exists).
-
Matrix Operations:
- Essential for understanding and implementing many statistical models, as they often involve matrix algebra for parameter estimation.
In the context of software like Stata, R, or Python's pandas library, these concepts are implemented using various functions and packages designed to handle non-linear regression, logistic regression, survival analysis, panel data analysis, etc. Each of these statistical environments has its own syntax and approach to conducting these analyses.
For example, in R:
- You can use the
nls()function for non-linear least squares. - The
glm()function with thefamily = binomialargument for logistic regression. - The
survivalpackage provides functions likecoxph()for survival analysis. - The
plm()function from theplmpackage can be used for panel data analysis.
In Stata, commands like logit, nlcom (for non-linear regression), and survey: regress for panel data with fixed or random effects are commonly used.
Remember that while each statistical method has its own set of assumptions and appropriate use cases, the choice of model should always be guided by the nature of the data and the research question at hand.
Course Gallery


Loading charts...