The Complete Technical Analysis Trading Course (2025)

Why take this course?
🚀 Welcome to Your Trading Transformation! 📈
Course Overview:
The Complete Technical Analysis Trading Course (2024) is the ultimate guide for anyone looking to master technical analysis and revolutionize their trading journey. This isn't your garden-variety course; it's a comprehensive, hands-on program designed to elevate your financial acumen and profitability in the stock market. 🎓
Why You Need This Course: Trading stocks without technical analysis is like sailing in a storm without a compass. It's not just about making trades; it's about understanding the market dynamics to make informed, profitable decisions consistently. 🌤️
What You'll Learn:
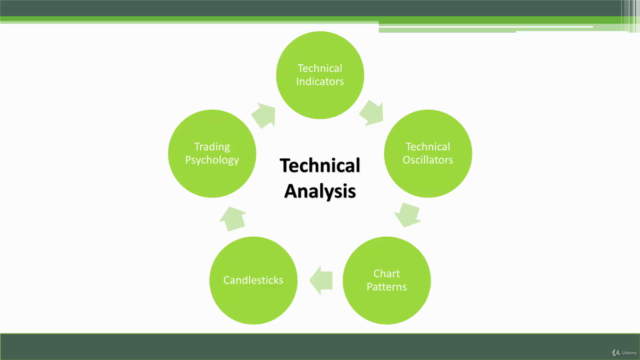
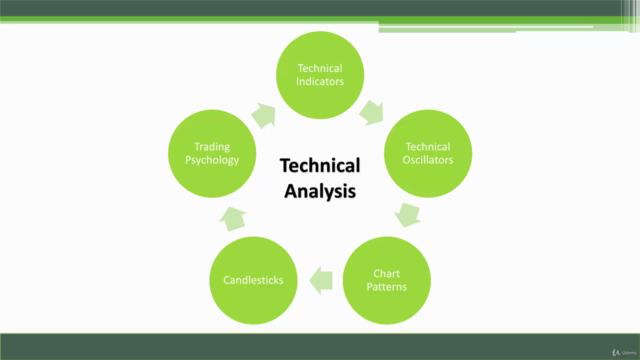
- Profitable Indicators & Patterns: Discover the most effective technical analysis indicators, oscillators, chart patterns, and candlestick signals with practical examples.
- Chart Interpretation Mastery: Learn to read stock charts accurately to spot market trends with precision.
- Time Frame Analysis: Gain the ability to analyze multiple time frames to make smarter trade entries.
- Support & Resistance: Use these pivotal points to determine your entry and exit strategies effectively.
- Complete Patterns Breakdown: From simple single candlestick patterns to complex triple ones, our course covers them all.
- Lifetime Course Access: Benefit from lifetime access to all course materials and updates to stay ahead of the game.
Additional Resources & Support:
- Market Analysis Deep Dive: Understand the intricacies of market analysis, risk management, and trade execution.
- Charting Tools: Get access to powerful charting tools and resources that will boost your trading performance.
- Community Support: Join a supportive community of traders who are all on their journey to master technical analysis.
Your Decision:
You have two paths before you. Will you continue down the same road, hoping for different results, or will you take the leap and enroll in The Complete Technical Analysis Trading Course? 🤔
- Path 1: Remain on your current path, where frustration and a lack of understanding may leave you financially where you started.
- Path 2: Transform your trading skills with our course and potentially quadruple your wealth, all while gaining the freedom and confidence that come with financial independence.
The Choice is Yours: Are you ready to take control of your financial future? If you're nodding along, understanding the importance of technical analysis, then it's time to act. 🌟
- No More Excuses: Don't let another day pass without taking this critical step towards financial mastery.
- Seize the Opportunity: With the knowledge from this course, you can start making smarter trades today and watch your investment portfolio grow in the coming months.
Enroll Now to Begin Your Journey! Don't let another year go by without harnessing the full potential of technical analysis. Join thousands of successful traders who have transformed their lives with this powerful tool. 🚀
- Limited Time Offer: Secure your spot in the course with an exclusive offer.
- Risk-Free Decision: With our money-back guarantee, you have nothing to lose but everything to gain.
Take the First Step Towards Financial Freedom Today! 💼💹 Your future self will thank you for it. Enroll in The Complete Technical Analysis Trading Course now and start your transformation into a confident, skilled, and profitable trader. Let's embark on this journey together! 🤝
Ready to Dive In? Click the link below to enroll and unlock your potential:
👉 Enroll in The Complete Technical Analysis Trading Course (2024)
Your financial independence is just a course away. Are you ready to seize it? 🌐💰
Course Gallery


Loading charts...
Comidoc Review
Our Verdict
The Complete Technical Analysis Trading Course offers an extensive look into the world of technical indicators, oscillators, and chart patterns. With real-world examples, dedicated support from instructors, and an engaging teaching style, learners gain a solid understanding of essential concepts in financial trading. However, improvements in clarity, precision, and depth of explanations will add significant value to this course for both beginners and seasoned traders alike.
What We Liked
- Comprehensive coverage of Technical Analysis indicators and oscillators
- Dedicated support from instructors and learning community
- Real-world examples and chart patterns make concepts tangible
- In-depth exploration of Support & Resistance levels
Potential Drawbacks
- Redundancy in content delivery across modules
- Some explanations lacking precision and clarity
- Limited discussion on timeframe settings for trend analysis
- Higher expectations set for depth and in-depth learning