R Data Analysis with Projects – Hands On: 3-in-1

Why take this course?
📚 Course Title: R Data Analysis with Projects – Hands On: 3-in-1
Hold on to Your Data Analysis Journey with Our Comprehensive R Course!
Overview:
R is a powerful tool for statistical analysis and data manipulation, and its popularity continues to surge among data scientists and analysts. This 3-in-1 course is meticulously designed to equip you with the essential skills to master both the basics and advanced techniques of R for real-world data analysis.
Course Structure:
This course is divided into three distinct parts, each tailored to progressively build your expertise:
-
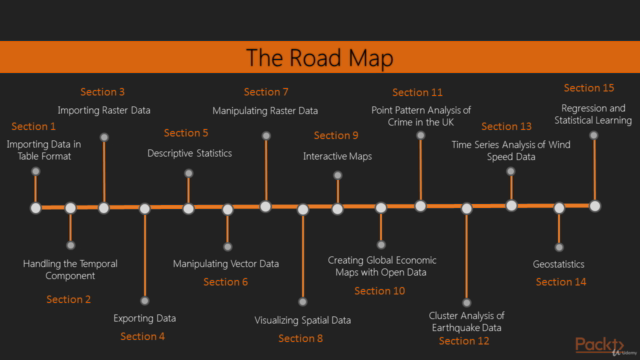
Learning Data Analysis with R
- Dive into the fundamentals of importing data and learn advanced techniques for managing even the most challenging datasets.
- Explore the creation of static plots and visualize data on interactive platforms like Google Maps and Open Street Maps.
-
Mastering Data Analysis with R
- Uncover the secrets of advanced analysis methods including cluster analysis, time-series analysis, and sentiment analysis.
- Master PCA (Principal Component Analysis), handling missing data, spatial data analysis with R and QGIS, and advanced visualization with ggplot2.
-
R Data Analytics Projects
- Put your knowledge to the test with hands-on projects that will help you understand and apply machine learning and data analysis concepts in practical scenarios.
- Gain insights into data manipulation, exploration, visualization, and more.
What You'll Learn:
- Fundamentals of R: Importing data, data cleaning, and basic statistical analysis.
- Advanced Data Analysis Techniques: Cluster analysis, PCA, time-series forecasting, sentiment analysis, and spatial data analysis.
- Data Visualization: Master the art of visual storytelling with ggplot2 in R.
- Machine Learning Applications: Apply machine learning techniques to derive actionable insights from data.
- Project Work: Complete three comprehensive projects that simulate real-world data analysis scenarios.
Why Choose This Course?
- Expert-Led Training: Learn from renowned experts like Fabio Veronesi, Dr. Bharatendra Rai, Raghav Bali, and Dipanjan Sarkar.
- Hands-On Experience: Engage with practical projects that reflect real-world data analysis challenges.
- Comprehensive Learning Path: A structured learning journey from beginner to advanced levels in R data analysis.
- Versatile Skill Set: Gain a skill set that is highly sought after in the fields of statistics, finance, healthcare, and more.
Your Instructors:
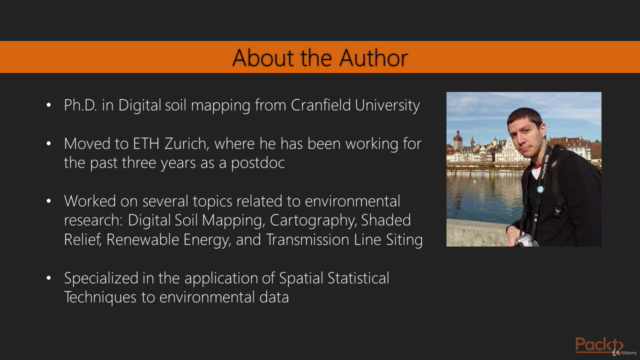
Fabio Veronesi is an expert in geospatial data analysis with extensive experience in applying R for practical problem-solving. His expertise spans across various domains including agriculture, environmental science, and urban planning.
Dr. Bharatendra Rai brings a wealth of knowledge from his experiences in quality engineering, Six-Sigma, and research at Ford Motor Company. His academic background and industry exposure make him an ideal mentor for analytics and data science.
Raghav Bali is a seasoned Data Scientist at Optum, part of the United Health Group. With a master's degree in Information Technology, he specializes in machine learning, deep learning, and has authored several books on these topics.
Dipanjan Sarkar is a Data Scientist at Intel, dedicated to making the world more connected and productive through data-driven solutions. His expertise includes analytics, business intelligence, and large-scale intelligent system development.
Get Started Today!
Embark on your journey to mastering R for data analysis with this comprehensive course. Enroll now and take the first step towards becoming an expert in data analysis and visualization with R. 📊
Enroll Now and unlock the full potential of your data!
Course Gallery
Loading charts...