Python: Data Visualization using Python

Why take this course?
🎓 Python: Data Visualization using Python
Course Headline:
Learn Python for data visualization with bqplot, NetworkX, and Bokeh
Course Description:
🔍 Introduction to Data Visualization with Python: Dive into the world of data visualization using Python's robust libraries. This course is designed for Python enthusiasts looking to expand their expertise in visual communication or those new to the field aiming to master data visualization techniques. With a focus on interactive and real-time data representation, you'll learn to harness the power of Python libraries like bqplot, NetworkX, Bokeh, and Dash to create compelling visualizations.
⚛️ Hands-On Learning with Real-World Applications:
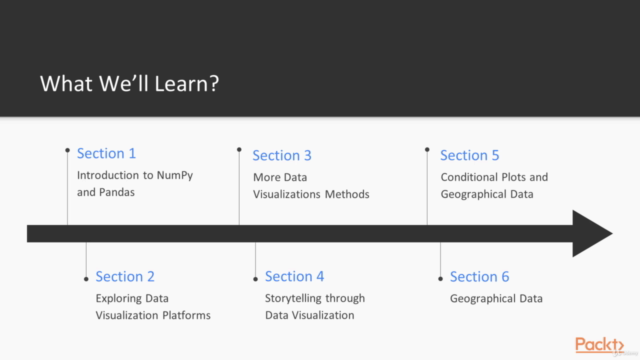
- Getting Started with Data Visualization Concepts: Understand the foundational aspects of data visualization and learn how to import/export data using various formats such as CSV, Excel, JSON, and more.
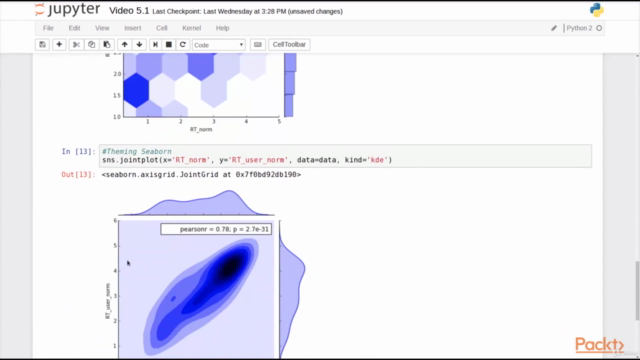
- Mastering Visualization Types: Explore a variety of visualization types including bar charts, histograms, scatter plots, and geospatial data representations. Customize your visualizations to present data in the most impactful way.
- Advanced Techniques and Real-Time Data Visualization: Step up your game by learning complex techniques like real-time data representation and gain insights into advanced customization options for your plots.
🌟 Interactive Visualizations with bqplot & Bokeh:
- Programming with bqplot: Learn to create stunning interactive visualizations using this Bloomberg open-source library.
- Network Graphs and Visualizations with NetworkX: Understand how to represent complex network data and visualize it effectively.
- Web Visualizations with Bokeh: Transition from static plots to dynamic web-based visualizations that respond to user inputs in real-time.
🔍 Real-World Data Sets & Effective Visualization: By the course's conclusion, you'll have demonstrated your ability to visualize interesting and complex real-world data sets using Python libraries such as matplotlib, bqplot, NetworkX, Bokeh, and Dash.
Contents and Overview:
This comprehensive training program consists of two meticulously selected courses designed to give you a thorough understanding of Python's data visualization capabilities.
-
Learning Python Data Visualization:
- Begin with the basics of data visualization concepts.
- Explore key libraries like Matplotlib and import/export various data formats.
- Learn to work with real-world datasets and customize your visualizations.
- Progress to intermediate topics, including real-time data visualization, to create advanced visualizations.
-
Data Visualization Projects in Python:
- Program interactive data visualizations using bqplot.
- Learn how to create interactive network graphs and visualizations with NetworkX.
- Visualize data interactively with Bokeh, allowing users to control various inputs for dynamic plot generation.
About the Authors:
Benjamin Keller: A postdoctoral researcher at Universität Heidelberg's Astronomisches Rechen-Institut, Benjamin's expertise lies in numerical modeling of the interstellar medium over cosmological timescales. His background includes physics and computer science, with a PhD from McMaster University and a BSc from the University of Calgary.
Harish Garg: With 17 years of software industry experience, including over 11 years at McAfee/Intel, Harish is a skilled Data Scientist and Lead Software Developer. He has extensive experience in creating data visualizations using R, Python, and web-based libraries, making him an invaluable author for this course.
Embark on a journey to become a proficient data visualizer with Python. Enroll now and transform your ability to represent and analyze data effectively! 📊🚀
Course Gallery


Loading charts...