Prometheus | The Complete Hands-On for Monitoring & Alerting

Why take this course?
🌟 Course Title: Prometheus | The Complete Hands-On for Monitoring & Alerting
Course Headline:
Unlock the Full Potential of Your DevOps Monitoring & Alerting with Prometheus & Grafana - From Novice to Expert! 🚀
Course Description:
Prometheus has emerged as a game-changer in the realm of system monitoring and alerting, securing its place as a Top-level project of the Cloud Native Computing Foundation (CNCF). This comprehensive course is meticulously designed to take you on a journey from the fundamentals to mastering advanced Prometheus concepts and their implementation. 📚➡️🚀
What's included in the course?
-
Complete Prometheus Concepts: Dive into Prometheus from Scratch to ADVANCED with real-time implementation scenarios. 🕒
-
Hands-On Learning: Each concept is accompanied by hands-on examples, ensuring you understand not just the theory but also how it applies in practice. 🛠️
-
In-depth Details: We leave no stone unturned, covering every aspect of Prometheus, even those areas where understanding is often lacking in official documentation. 🔍
Technicalities Covered:
-
A multitude of (official & 3rd party) exporters.
-
Comprehensive guide to Prometheus Query Language (PromQL), including Functions, Operators, Clauses, and more.
-
Instrumenting Python or Go applications to expose custom metrics using Client Libraries.
-
Implementing Service Discovery for dynamically adding or removing scrape targets.
-
Setting up Recording Rules to capture the metrics you're interested in.
-
Monitoring Amazon Cloud (AWS) with Prometheus.
-
Designing and implementing a routing tree for alerting systems.
-
Creating your own Custom Exporter. 🛠️
-
Integrating with Alert Notifiers like Gmail, PagerDuty, and Slack.
-
Scraping from batch jobs using Pushgateway.
-
Constructing monitoring & alerting design patterns in a Real-Time case study using Prometheus.
-
Building value-added dashboards with Grafana.
-
Following best practices and understanding the Do's & Don'ts in monitoring for Real-Time DevOps Projects.
Add-Ons:
-
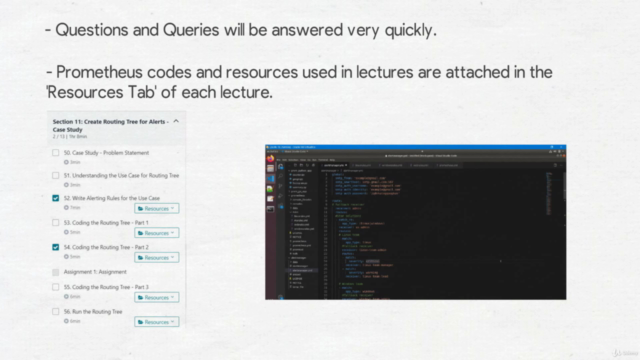
Prompt Support: Questions and queries will be answered swiftly, ensuring your learning journey is smooth and uninterrupted. ⏫
-
Resources Included: All Prometheus codes and additional resources used in lectures are attached for your convenience and further exploration. 📚
-
Continuous Updates: The course content will be frequently updated with new components of Prometheus to keep you at the cutting edge of monitoring solutions. 🎉
By the end of this course, you'll be equipped with the knowledge and skills to confidently approach any Prometheus project, ensuring your systems are monitored and alerted as efficiently and effectively as possible. Join us on this enlightening journey into the world of DevOps monitoring and alerting with Prometheus & Grafana! 🎓💫
Course Gallery


Loading charts...
Comidoc Review
Our Verdict
The 'Prometheus | The Complete Hands-On' course provides learners with solid foundational knowledge about Prometheus monitoring & alerting. However, the missing Kubernetes section and uneven depth of some topics may leave more experienced DevOps professionals wanting more. The instructor's strong Indian accent might also pose a barrier. While there is certainly value in this Udemy course, those expecting comprehensive exploration of advanced concepts will need to look elsewhere.
What We Liked
- Comprehensive coverage of Prometheus' core concepts, including architecture, installation, PromQL, exporters, functions, operators, and more.
- Hands-on examples with Python & Go web applications' instrumentation to expose Prometheus metrics using client libraries.
- Real-time case studies' monitoring & alerting design implementation using Prometheus, along with Service Discovery, Recording Rules, and Routing Trees.
- Instructor's clear explanations, thoroughness, and structured approach make complex concepts easy to understand.
- Valuable insights on building dashboards with Grafana and integration with popular alert notifiers such as Gmail, PagerDuty, and Slack.
Potential Drawbacks
- Lacking depth in some areas of the course with examples being relatively simple and not always demonstrating all aspects.
- Kubernetes part is missing from the course despite repeated promises to add it in Q&A section by the creator for over 3 years.
- Strong Indian accent of the instructor can be challenging for certain students and may hinder their motivation and ability to focus on content.
- Lack of engagement with audience and not responding to questions raised by them, affecting overall learning experience.