Zero to Hero in Power BI: Data Visualization using Power BI
Make data models, prepare data using Power Query, create charts & reports and do advanced analysis using DAX in Power BI
4.50 (1432 reviews)

21 600
students
7.5 hours
content
May 2025
last update
$69.99
regular price
What you will learn
Discover the Power BI interface and its key components, such as visuals, filters, and data fields.
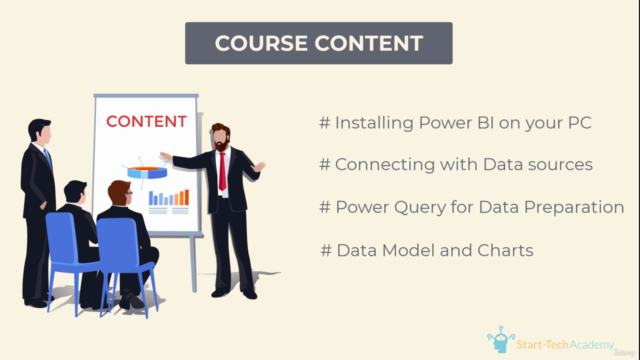
Master the process of importing and transforming data from different sources to create clean, structured datasets.
Create interactive and visually appealing dashboards using a variety of charts, graphs, and slicers.
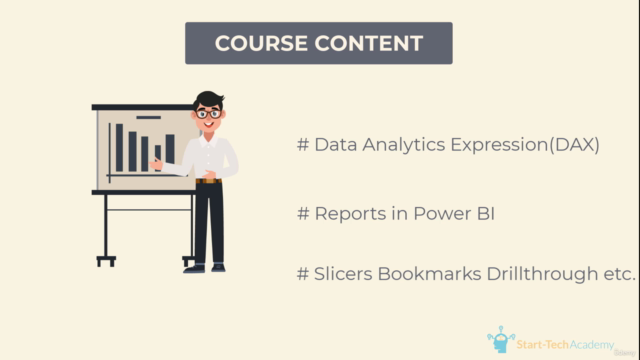
Implement advanced data analytics techniques, including measures, calculated columns, and DAX formulas.
Utilize Power Query to perform data cleansing, transformation, and data shaping operations effectively.
Explore the integration of geographic data and learn how to create informative maps and location-based visualizations.
Master the art of designing compelling reports that communicate insights effectively to various stakeholders.
Course Gallery

Loading charts...
5467762
udemy ID
27/07/2023
course created date
30/07/2023
course indexed date
Bot
course submited by