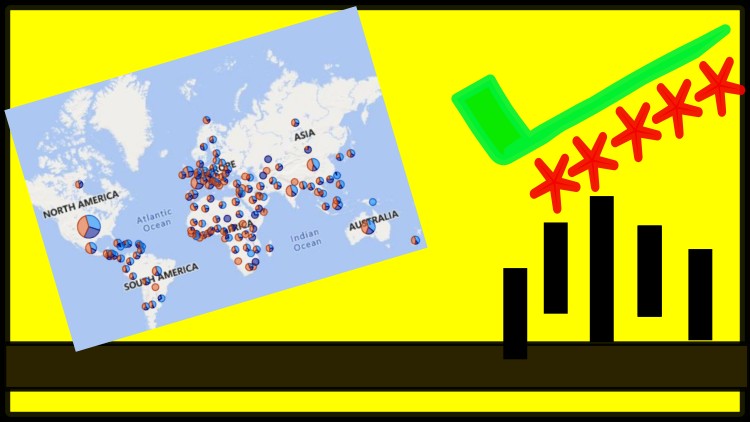
Power BI for Data Visualization and Analysis

Why take this course?
🎉 Master Data Visualization and Analysis with Microsoft Power BI! GroupLayout your data like a pro and uncover the stories hidden within numbers with our comprehensive online course: "Power BI for Data Visualization and Analysis". 📊🚀
Course Overview:
Discover the power of business intelligence with Microsoft Power BI, the tool that transforms raw data into actionable insights. In this course, you'll learn how to harness the full potential of Power BI for data visualization, analysis, and storytelling. Whether you're new to data analytics or looking to sharpen your skills, this course is designed to guide you through every step of the process.
What You'll Learn:
- The Fundamentals of Data Visualization: Understand the importance of visualizing data and how to get started with Power BI.
- Data Wrangling Techniques: Master data transformation, summarization by grouping, joining data tables, and more to prepare your datasets for analysis.
- Advanced Data Analysis: Explore creating calculated columns, measures, and learning the difference between them. Discover how to apply data hierarchy and grouping categories effectively.
👉 Key Features of the Course:
- Diverse Visualizations: Dive into a wide range of charts including Stacked Column & Bar Charts, Line Charts, Area & Stacked Area Charts, Pie & Donut Charts, and more!
- Geographical Insights: Learn to visualize data geographically with Maps.
- Tabular Format Mastery: Present your data in a tabular format using Table, Matrix, Cross-tab, and Cards.
- Interactive Data Slicing & Filtering: Understand the three modes of filtering and how to visualize data slicing.
Hands-On Data Analysis:
- Trend Analysis: Learn to identify patterns with trend lines, constant lines, max-min lines, and average & median lines.
- Forecasting & Clustering: Predict future trends and understand your data clusters for better decision-making.
📈 Elevate Your Data Skills:
- Visual Storytelling: Present compelling narratives with your data using visualizations that highlight key insights.
- Real-World Applications: Apply what you learn in scenarios that mimic real business environments.
- Interactive Learning: Engage with a community of like-minded learners and professionals.
By the end of this course, you'll be equipped with the skills to turn complex datasets into clear, actionable visualizations with Power BI. You'll be able to spot trends and patterns that drive business decisions and tell a story with your data. Enroll now and take the first step towards becoming a data visualization expert! 🌟
Course Features:
- Self-Paced Learning: Complete the course at your own pace, whenever it fits into your schedule.
- Expert Instruction: Learn from industry professionals with real-world experience in data visualization and analysis.
- Interactive Exercises: Apply your new skills directly within Power BI through hands-on practice exercises.
- Accessible Anywhere: Take this course wherever you go, on any device with an internet connection.
Unlock the secrets of your company's data and transform the way you analyze and visualize information with "Power BI for Data Visualization and Analysis". 🎓💡 Enroll today and empower your business intelligence journey!
Loading charts...