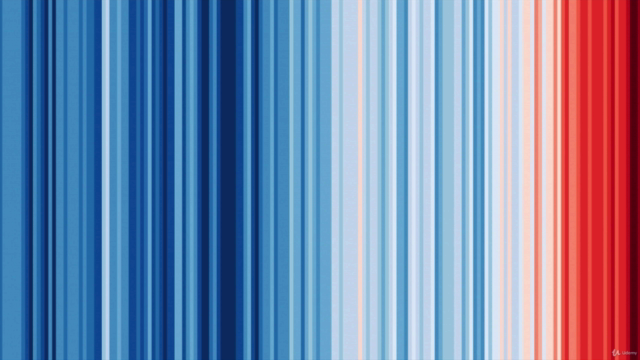
How to Visualize Data with D3
Learn the D3 JavaScript library and create a data visualization using real science data
4.39 (23 reviews)

1 304
students
1.5 hours
content
Jan 2020
last update
$15.99
regular price
What you will learn
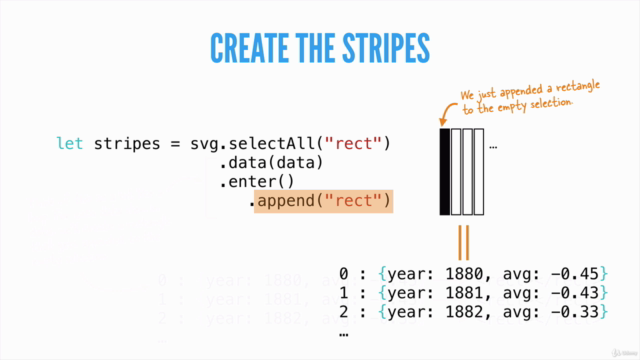
JavaScript, D3, data visualization
Course Gallery

Loading charts...
Related Topics
2736796
udemy ID
03/01/2020
course created date
26/05/2021
course indexed date
Bot
course submited by