Going from Beginner to Advanced in ggplot2
Why take this course?
Course Headline: 📊 Going from Beginner to Advanced in ggplot2: Master Data Visualization with Confidence!
Course Description:
Hello, data enthusiasts! 🌍 If you're eager to dive into the world of data visualization and master the powerful ggplot2 package in R, then you've landed on the right course. My goal with this comprehensive curriculum is to help you learn ggplot2 from the ground up. 📈
Why This Course? Creating complex and beautiful data visualizations can be a daunting task for beginners. ggplot2 boasts an extensive array of functions, concepts, and techniques that seem overwhelming at first glance. While there are numerous resources online, they can often be fragmented and lack the cohesive, foundational teaching necessary to truly become an independent specialist in ggplot2. That's where this course comes in, offering a structured learning path that will take you from a beginner to an advanced user of ggplot2.
What You'll Learn:
- The Fundamentals: Understand the core concepts like data types, geometric objects, aesthetics, and mappings.
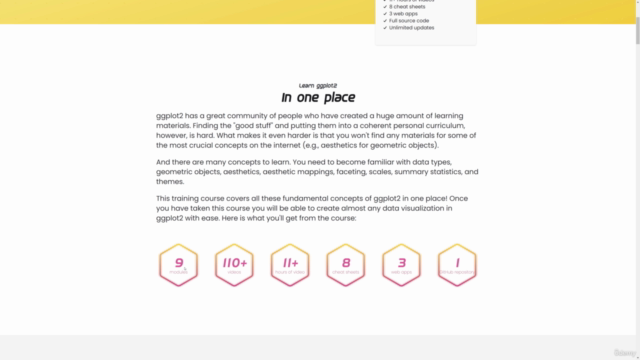
- Hands-On Learning: Engage with more than 12 hours of video content that will guide you through each concept step by step.
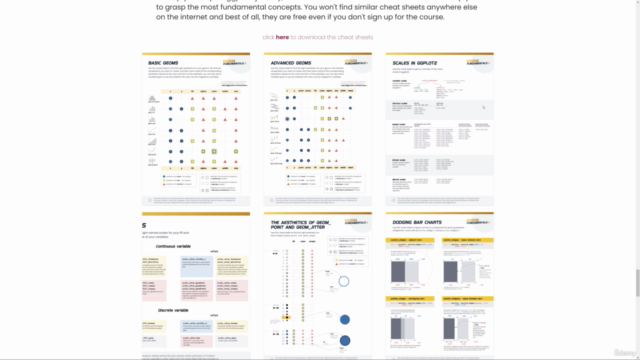
- Exclusive Materials: Access 8 unique cheat sheets that cover the essential aspects of ggplot2, three educational web apps for tackling common issues, and a repository filled with R code from the course.
- Practical Skills: Learn to avoid common pitfalls and develop a solid understanding of scales, faceting, summary statistics, and customizing themes.
- Real-World Application: Create four best practice visualizations that encapsulate all the fundamental concepts taught in this course.
Course Breakdown:
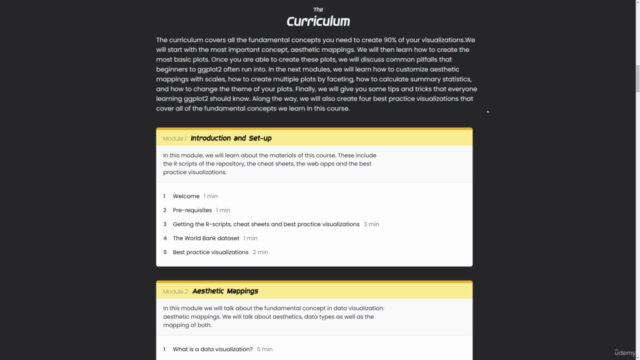
- Aesthetic Mappings: Discover the heart of ggplot2 by mastering how to map data to aesthetics within your plots.
- Basic Plots: Learn to create and interpret the most fundamental types of plots.
- Common Pitfalls: Identify and overcome obstacles that beginners often face while using ggplot2.
- Customization with Scales: Dive into the world of scales to refine your visualizations.
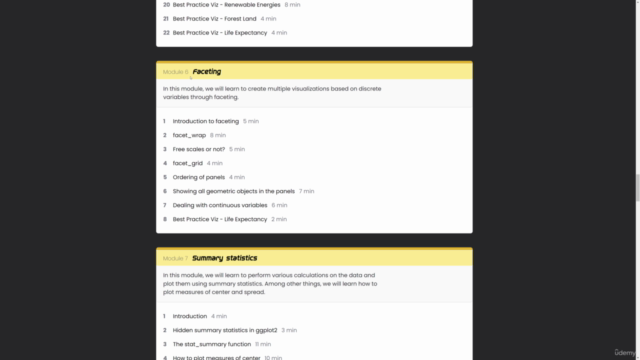
- Advanced Faceting: Explore how to combine multiple plots for a comprehensive data view.
- Calculating Summary Statistics: Learn to include crucial summary statistics in your visualizations.
- Theme Customization: Personalize the appearance of your plots with custom themes.
- Tips and Tricks: Uncover the hidden features and techniques that will set you apart as a ggplot2 user.
Why This Course Stands Out: I am confident in saying that the material and approach used in this course are unparalleled. With exclusive resources and a focus on practical application, you'll not only understand ggplot2 but also be able to apply your newfound skills effectively. Plus, we're covering the latest version of ggplot2 (3.3.4) to ensure you're learning the most up-to-date practices.
Join me on this journey, and by the end of this course, you'll have a solid grasp of ggplot2 that will propel your data visualization skills to new heights. 🎓
Disclaimer: We will cover version 3.3.4 of ggplot2, which may include some features introduced in more recent versions as they are backward compatible. However, always ensure to check the latest documentation for the most current practices.
Course Gallery
Loading charts...