Microsoft Excel Dashboard and Data Analysis Masterclass

Why take this course?
🌟 Unlock the Full Potential of Excel with Masterclass 2024! 🌟
Completely Updated in March 2024 with Over 40 Brand-New Videos!
🔥 Course Highlights:
- 20+ Years of Excel Mastery: Learn from a seasoned professional with over two decades of experience.
- Up-to-Date Content: Tailored to the latest 2024 job market trends and technologies.
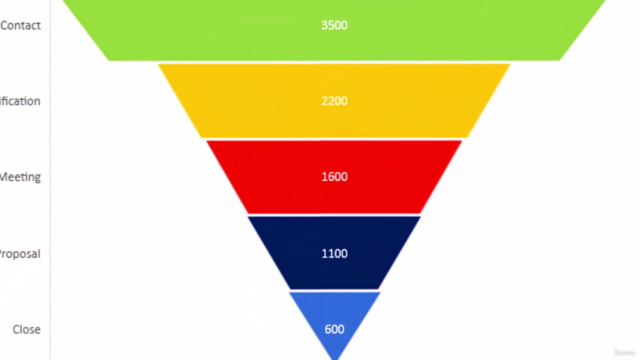
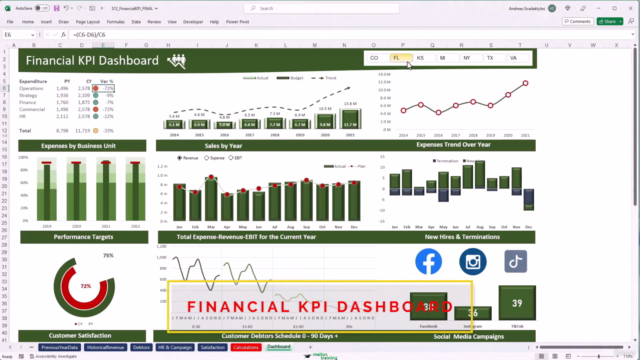
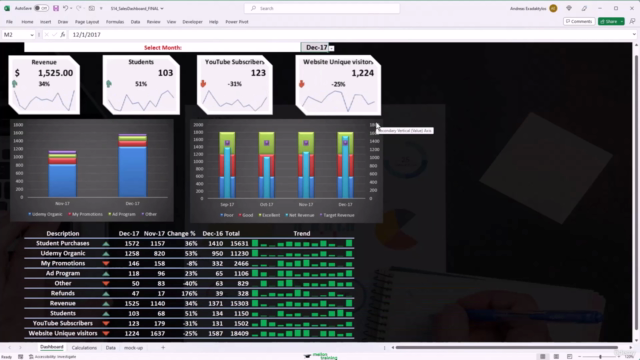
- Comprehensive Dashboard Creation: Build seven detailed dashboards from scratch, including a Business Sales Dashboard, Financial KPI Dashboard, Balanced Scorecard Dashboard, Pivot Slicer Dashboard, Traffic Lights Dashboard, and more!
- Real-World Application: Receive templates and samples that are immediately applicable to your business.
- Interactive Learning: Engage with quizzes, exercises, and hands-on practice to solidify your understanding.
- Offline Access: Over 100 pages of detailed documentation for easy reference and learning offline.
- Extensive Resources: Get access to over 50 examples and files, including a code-free version for immediate use.
- Personal Support: Enjoy one-on-one support throughout your learning journey.
- Money-Back Guarantee: 30 days risk-free with a full refund if you're not completely satisfied.
🎓 Course Breakdown:
- Introduction to Dashboards: Learn the fundamentals of Excel dashboards and their importance in business intelligence.
- Intermediate Excel Skills: Enhance your skills with advanced features like pivot tables, slicers, and more.
- Data Visualization Techniques: Master the art of turning complex data into easy-to-understand visual reports.
- Protecting Your Dashboard: Ensure your work is secure and shareable with the right permissions.
- VBA for Enhanced User Experience: Add a touch of automation to make your dashboards more interactive and user-friendly.
- Real-Life Application: Apply what you've learned with a major project, creating an auto parts sales dashboard from A to Z.
📚 Why Choose This Course?
- Structured Learning: The course is designed with an effective teaching approach that keeps you engaged and motivated.
- Continuous Updates: Regular updates ensure the content stays relevant and at the forefront of Excel capabilities.
- Engaging Presentation: The course incorporates a variety of learning materials, including videos, exercises, and real-world examples.
- Community of Learners: Join a community of peers who are also on their path to mastering Excel dashboards.
💡 Testimonials from Past Students:
- "I learned so many new Excel tricks from this course... It covers almost everything. Andreas impressed me by updating his course so often! It is worth every cent. Great job!" - Chris K
- "Outstanding course! Very thorough and easy to understand. Sample spreadsheets make it very simple to follow along and provide hands-on work. I would highly recommend this course." - Kelli Kellen
- "I strongly recommend the course for all types of Excel users... The lecturer follows a systematic and inspiring approach to present the most important techniques for data visualization with Excel." - Tommy Kalman
📈 Take the Next Step in Your Excel Proficiency: Enroll now to gain immediate lifetime access to over 17 hours of high-quality video content, downloadable project files, quizzes, homework exercises, and personal support. Ready to certify your new skills? Remember to print out your certificate of completion!
Don't wait to elevate your Excel expertise. Dive into Masterclass 2024 today and transform the way you handle data with powerful, professional dashboards! 🚀
Course Gallery


Loading charts...
Comidoc Review
Our Verdict
This bestselling course is an excellent starting point for those who want to create interactive Excel dashboards and data analysis projects. With a strong focus on practical application, it distinguishes itself from numerous beginner courses in the market. The instructor's extensive expertise in teaching Excel skills is also commendable. Although some updates would be welcome, recent user testimonials confirm that the course material is still relevant for students using the latest versions of Microsoft Office 365 Excel.
What We Liked
- Comprehensive course covering both standard and non-standard Excel charts, data analysis principles, and KPI dashboard creation
- Instructor with extensive experience using Microsoft Excel, teaching thousands of students in a physical computer learning school
- Real-world applications and exercises to enhance understanding of creating interactive dashboards and reports
- Highly positive recent testimonials highlighting the value and applicability of the course material
Potential Drawbacks
- Course last updated in 2023, but instructor states that all materials are still relevant for the latest Excel releases
- Several reviewers mentioned that they weren't able to grasp every concept during their first run through the course
- Some users may find certain features or techniques less frequently applicable depending on their day-to-day tasks
- Users looking for a quick, condensed tutorial without exercises should consider other options