Data Visualization with R and ggplot2

Why take this course?
🚀 Master Data Visualization with R and ggplot2! 📊
Course Headline:
R Programming Language for Data Visualization: Mastering Data Analysis, Data Preparation, and Data Science Tools with RStudio
Course Description:
In an era where data is king, the ability to visualize data effectively can transform raw numbers into compelling stories. Data Visualization stands as a critical skill in the modern data scientist's toolkit. With the R programming language and its powerful ggplot2 library, you can unlock your potential to create sophisticated and insightful data visualizations.
🔍 R is not just any tool; it's a robust platform for data science and statistics, offering a wide array of capabilities to analyze and visualize data with precision and elegance. Ggplot2 takes this further by providing a coherent, consistent system for creating graphics from first principles.
This course is meticulously structured to guide you through the fundamentals of data visualization, starting with a strong theoretical foundation. You'll then dive into the practical world of exploratory data analysis (EDA), where you'll interact with various datasets and learn to generate an extensive range of statistical plots.
What You'll Learn:
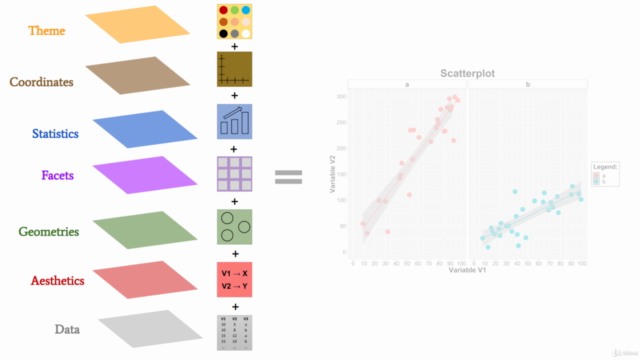
- The Grammar of Graphics - Understand the underlying principles behind ggplot2 and statistical plots.
- Data Transformation Techniques - Master data manipulation with dplyr and tidyr to prepare your data for analysis.
- Exploratory Data Analysis (EDA) - Explore datasets to uncover patterns using different types of statistical plots.
- Advanced EDA - Investigate relationships between multiple variables with complex plot types.
- Integrating ggplot2 with RMarkdown - Produce HTML reports to wrap up your analysis in a presentable format.
- Creating Additional Plot Types - Combine ggplot2 with additional libraries to generate word clouds, parallel coordinates plots, heat maps, radar plots, and more.
- Geospatial Visualization - Map out the spread of coronavirus disease to visualize geographical data.
- Customizing Plots - Personalize your plots by tweaking themes and elements.
- Creating Subplots - Organize multiple plots together using the cowplot library.
- Highlighting Data Points - Emphasize important data points with the gghighlight library.
Course Includes:
- Over 20 hours of comprehensive lecture videos to guide you through each concept.
- R scripts and additional datasets to practice and reinforce your learning.
- Assignments designed to test your skills, with walkthrough videos to help you understand the solutions.
Become a Data Visualization Expert!
This course is one of Udemy's most comprehensive offerings for data visualization using R and ggplot2. It's packed with real-world examples, practical exercises, and everything you need to elevate your data storytelling to the next level.
🎓 Enroll now and unlock the power of data visualization with R and ggplot2! Let's turn data into a visual narrative that speaks volumes! 🌟
Take the leap into the world of data science and visualization. With this course, you'll not only understand how to analyze and present data effectively but also how to make an impact with your findings. Sign up today and start your journey towards becoming a data visualization expert! 📈💻
Course Gallery


Loading charts...