Comprehensive Data visualization with Matplotlib in Python

Why take this course?
🚀 Comprehensive Data Visualization with Matplotlib in Python 📊
Course Headline:
From Beginner to Expert in Data Visualization using Matplotlib in Python
Course Description:
Welcome to the comprehensive journey into the world of data visualization using Python's powerful Matplotlib library! 🎉 This course has been meticulously crafted for a diverse range of learners - from students and hobbyists to working professionals. Our aim is to empower you with the skills to extract meaningful insights from your data and make informed decisions through effective visualizations.
Why Enroll?
- Interactive Learning: With quizzes and assignments designed to test your understanding at each stage, you'll be able to track your progress and solidify your learning.
- Real Python Code: Get instant access to downloadable Python code templates for each module. These serve as a base to customize your visualizations according to your data needs.
For Students: Dive into the world of data science with confidence, ready to tackle Datathon and Hackathon competitions or to illustrate your project findings in a compelling manner.
For Professionals: Enhance your data analysis toolkit by mastering the art of presenting complex data clearly and effectively through charts and plots.
For Hobbyists: Transform your interest into practical skills, understanding raw data from various sources with the expertise of a pro.
Course Curriculum Overview:
-
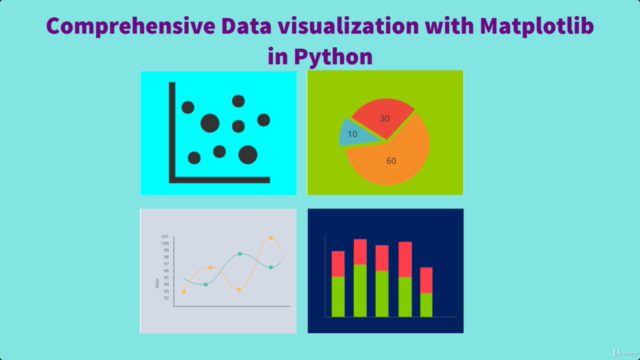
Basic to Advanced: This course takes you from the basics of Matplotlib to advanced visualization techniques. By the end, you'll be proficient in creating and customizing 2D and 3D plots, handling both linear and non-linear data, and exploring a multitude of plot types such as bar charts, stacked charts, XY plots, pie charts, histograms, polar plots, and logarithmic plots.
-
Time-Series Data: Gain valuable insights into financial and other time-series data through effective visualization.
-
Audio Signal Analysis: Learn to plot and analyze audio signals, adding a new dimension to your data storytelling.
-
Image Manipulation: Explore the basics of image manipulation within Matplotlib to extract and apply coloring schemes for enhanced data interpretation.
-
Versatile Visualization: Master visualizing all types of data with Matplotlib, making it an essential tool in your data analysis arsenal.
Tools You'll Use:
- Python 3: The programming language at the heart of this course (any version greater than 3.7 is suitable).
- Jupyter Notebook: Your ideal integrated development environment (IDE) for interactive coding and visualization exploration.
- Matplotlib: The robust data visualization library that will transform your approach to working with data.
🚀 Join us on this data adventure! 📈 Whether you're a student, a professional, or a hobbyist eager to unlock the secrets of data visualization, this course is your stepping stone to mastery with Matplotlib in Python. Let's embark on this learning journey together and turn data into compelling stories with captivating visualizations!
Enroll now and visualize your path to becoming a data maestro! 🌟
Course Gallery


Loading charts...