Data Visualization in Excel: All Excel Charts and Graphs

Why take this course?
🌟 Master Data Visualization in Excel with Start-Tech Academy's Comprehensive Course!
Course Headline:
"📊 25+ Excel Charts and Graphs - Data Visualization in Microsoft Excel for Excel 2007 to Excel 2019"
Dive into the World of Excel Charting with Our Expert-Led Course!
Are you ready to transform your data into compelling visual stories? Look no further! In this in-depth course, we'll explore over 25 different chart types in Excel, from the classic Column and Line Charts to more advanced ones like Doughnut, Bubble, Surface, Radar, Combo, and Pivot Charts. We'll also cover Sparklines and many other creative options! 📈
What You'll Learn:
Chart Types Covered:
- ✅ Column Chart
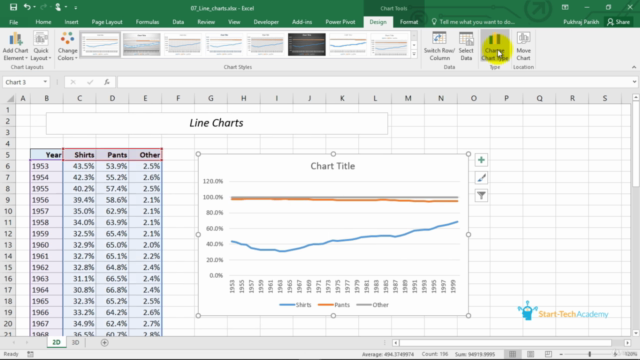
- ✅ Line Chart
- ✅ Pie Chart
- ✅ Doughnut Chart
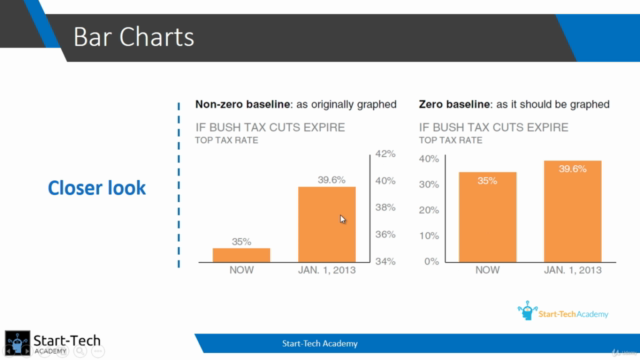
- ✅ Bar Chart
- ✅ Area Chart
- ✅ XY (Scatter) Chart
- ✅ Bubble Chart
- ✅ Stock Chart
- ✅ Surface Chart
- ✅ Radar Chart
- ✅ Combo Chart
- ✅ Pivot Chart
- ✅ Sparklines
- ...and more!
The Power of Charts in Excel:
Charts are not just graphs; they're a powerful way to communicate data. They simplify complex data sets, making trends and comparisons easy to understand. With Excel charts, you can present your data more effectively and make it more digestible for your audience. 📉
Why Use Charts in Excel?
- ✨ Clear Communication: Transform numbers into visual narratives that are easy to understand.
- 🎨 Improved Presentation: Make your data presentations look more professional and appealing.
- 🔍 Easier Analysis: Spot trends, patterns, and outliers in your data at a glance.
Unlock the Full Potential of Excel Charts!
This course will guide you through every aspect of creating impactful charts:
- ✅ Enhancing Chart Appearance: Learn how to format charts for maximum impact.
- ✅ Understanding Chart Elements: Get familiar with titles, legends, axes, and data labels.
- ✅ Creating Infographics: Discover how to craft those eye-catching infographics you see in professional settings.
- ✅ Comparison Charts: Find out the best chart types for comparisons and how to create them in Excel.
Why Choose Our Course?
Unlike other resources, this course doesn't just show you how to make a chart—it teaches you how to tell a story with it. You'll learn the principles of effective data visualization and how to present your data in a clear, concise, and impactful way. 🎓
FAQs:
How do I make my Excel charts look better? Learn formatting techniques that will enhance the visual appeal of your charts.
What are the different elements of charts in Excel? Understand each component, from titles and legends to axes and data labels, to create a chart with clarity and purpose.
How do I make those awesome infographics? Discover how to combine multiple charts and elements into compelling infographics that tell a story.
What's the best chart type for comparison? Explore different types of comparison charts, such as line, bar, and combo charts, and learn when to use each one effectively.
Don't miss out on the opportunity to elevate your data analysis skills with our comprehensive course on Excel Data Visualization! Enroll now and become a pro at presenting your data in the most compelling way possible. 🎆
Course Gallery
Loading charts...
Comidoc Review
Our Verdict
Data Visualization in Excel: All Excel Charts and Graphs provides a comprehensive exploration of various chart types in Excel, along with practical exercises to reinforce learned concepts. While it covers basic and advanced charting techniques, the course might not fully satisfy intermediate or advanced users seeking more in-depth information about formatting options and best practices for data visualization.
What We Liked
- Covers a wide range of Excel chart types, including advanced ones like sunburst, treemap and waterfall
- Practical, hands-on approach with numerous exercise sheets to practice learned concepts
- Detailed explanation of pivot tables and pivot charts - useful for data analysis
- Clear and concise overview of Excel's data visualization options
Potential Drawbacks
- Lacks advanced features, formatting options, and elements in the charting area
- Accent can be challenging to understand in some lectures
- Exercises are more complex than examples shown, leaving some learners feeling lost and needing additional guidance
- Could benefit from covering common mistakes and best practices when visualizing data