Ms. Excel PivotTable For Data Analysis

Why take this course?
📊 Mastering Data with Ms. Excel's PivotTable & PivotChart: A Comprehensive Online Course
Course Title:
Ms. Excel PivotTable For Data Analysis
Headline:
🚀 "Summarize, Analyze, and Visualize all types of data on PivotTable and PivotChart easily and effectively."
Why learn PivotTables and PivotCharts? 🧐
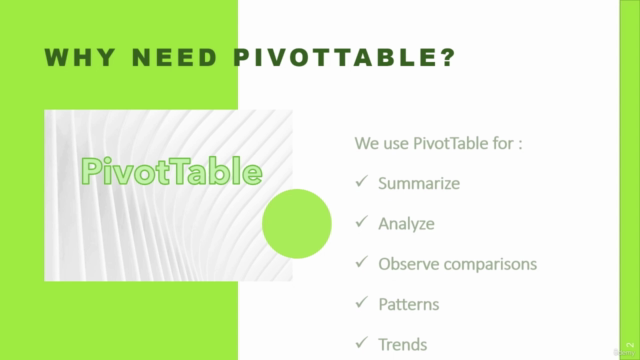
PivotTables are a game-changer in the realm of data analysis. They enable you to:
- Summarize and Explore Data: Easily summarize large data sets, discover hidden patterns, and spot significant trends without manually manipulating formulas.
- Visual Analysis: Complement your PivotTable findings with PivotCharts for a more intuitive understanding of your data through visuals.
- Informed Decision Making: Make strategic decisions based on reliable summary data and visual insights, which are crucial for the success of any organization.
- Versatility: Connect to a myriad of data sources, including SQL Server, Analysis Services cubes, Azure Marketplace, Office Data Connections (ODC), XML files, Access databases, and text files, or even use existing PivotTables as your foundation.
What will you learn in this course? 📖
This course is meticulously designed to take you from a beginner to an expert in using PivotTables and PivotCharts for data analysis. Here's what you'll cover:
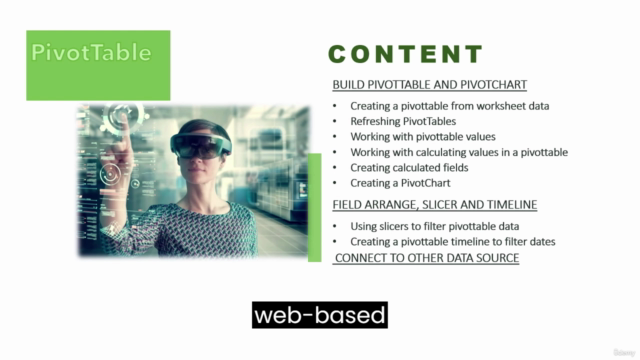
1. Building Your First PivotTable and PivotChart
- Creating a PivotTable: Learn how to transform your data into meaningful summaries.
- Refreshing PivotTables: Discover how to update your PivotTables with new data.
- Working with PivotTable Values: Understand how to analyze and manipulate data within a PivotTable.
- Calculating Values in a PivotTable: Master the art of custom calculations to suit your specific needs.
- Creating Calculated Fields: Learn how to create new data fields based on existing data for more detailed analysis.
- Creating a PivotChart: Transform your PivotTable into an engaging and informative chart to visualize data trends and patterns.
2. Enhancing Your PivotTable with Field Arrange, Slicer, and Timeline 🛠️
- Using Slicers: Filter large volumes of data efficiently by setting up slicers that allow for easy, dynamic filtering.
- Timelines: Easily navigate through your data's time dimensions to identify key patterns over different time periods.
3. Connecting to Other Data Sources 🔗
- Connecting PivotTables from Various Sources: Learn how to link PivotTables to external data sources for a more comprehensive analysis.
- Changing the Source Data: Update your PivotTable with new or different source data while keeping all your existing configurations intact.
- Using Another PivotTable as a Data Source: Leverage the power of existing PivotTables by using them as sources for your new analyses.
- Creating a PivotTable Connected to Power BI Datasets: Combine the capabilities of Power BI with Excel's robust PivotTable functionalities.
Who should take this course? 👤
This course is tailored for professionals and enthusiasts across various domains who are involved in data handling, including but not limited to:
- Data Engineers: Streamline your data management processes with efficient PivotTable analysis.
- Data Analysts: Gain insights from complex datasets easily and present them visually.
- Data Scientists: Use advanced calculating methods and visualizations in Excel for a deeper understanding of large datasets.
- M&E Specialists: Enhance your monitoring and evaluation capabilities with powerful data summarization techniques.
- Everyone Interested in Data Analysis: Whether you're a student, business analyst, or simply someone who wants to understand more about their data, this course is for you.
Join Ms. Excel on this journey to master the art of PivotTables and PivotCharts. Elevate your data analysis skills and transform the way you handle data in your professional life. Enroll in our "Ms. Excel PivotTable For Data Analysis" course today and unlock the full potential of your data! 🌟
Course Gallery


Loading charts...