Data Visualization with Python and New Methods in Matplotlib

Why take this course?
🚀 Course Title: Data Visualization with Python and New Methods in Matplotlib
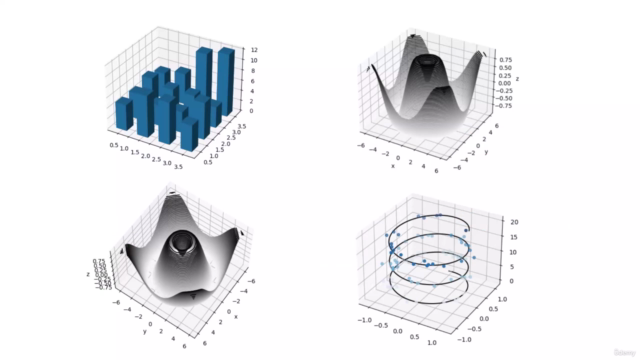
🎓 Course Headline: Step-by-step training for 3D and advanced visualization in Python and Matplotlib (with all the codes)
Unlock the Secrets of Your Data with Advanced Visualization Techniques!
🚀 Course Description:
Are you ready to elevate your data analysis skills to the next level? In this comprehensive course, renowned instructor S. Emadedin Hashemi will guide you through mastering advanced data visualization using Python, a versatile and powerful tool for data scientists. 📊
This course is a testament to the power of visual storytelling with data. By the end of this course, you'll not only understand how to create advanced visualizations but also how to communicate your findings effectively. You'll be able to produce compelling graphics that can be used in presentations, scientific papers, and even advertisements. 🌟
💻 What You'll Learn:
- Advanced Python data manipulation and analysis techniques
- Innovative ways to use Matplotlib for 2D and 3D visualizations
- How to present complex datasets in a clear and visually appealing manner
- Best practices for creating engaging and informative charts, graphs, and plots
- And much more!
🎓 Enroll Now and Transform Your Data into Stories That Matter! 💫
By taking this course, you'll join the ranks of data professionals who use Python and Matplotlib to extract insights from their data and communicate those findings to a wide audience. Ready to dive into the world of advanced data visualization? Let's get started! 🎯✨
Course Gallery


Loading charts...